Devpost
Participate in our public hackathons
Devpost for Teams
Access your company's private hackathons
Grow your developer ecosystem and promote your platform
Drive innovation, collaboration, and retention within your organization
By use case
Blog
Insights into hackathon planning and participation
Customer stories
Inspiration from peers and other industry leaders
Planning guides
Best practices for planning online and in-person hackathons
Webinars & events
Upcoming events and on-demand recordings
Help desk
Common questions and support documentation
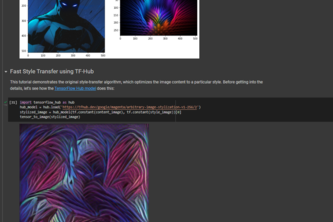
It uses deep learning to compose one image in the style of another image.
Twitter sentimental analysis
Web calculator
Programming Learning Platform
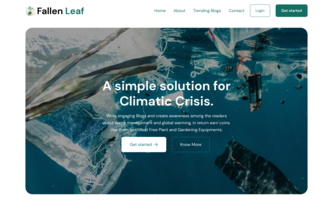
A nature related website
One of the top 5 reasons that people don't recycle is its difficulty; people are easily infuriated by wondering which items are recycled and which aren't. Recyca-Tool fixes this problem!
Join me in my journey
Gait Analysis
Writing Blogs can earn you Plants
Writing Blogs can give you Free Plants 🌱. Isn't it Interesting.
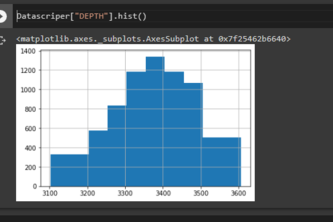
This is Representation of drilling site where there is probability of finding oil.
Animated Bar Chart based on the Titanic 🛳 dataset!
Analysis of IPL dataset is done here.
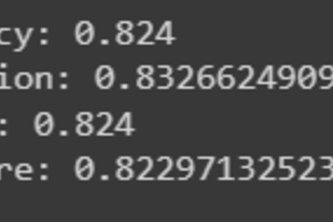
This model takes in text data and predicts the sentiment behind it. The goal is to help businesses and organizations better understand the public sentiment towards their brand, products,and services.
I just wanted to play around with Bootstrap.
Fine tune a pretrained roberta transfomer model from Hugging Face using the Trainer API.
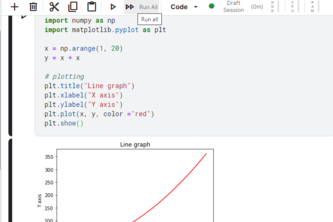
It's a Line chart Implementation
It's a boostraped clone which can fetch the real time data from the users.
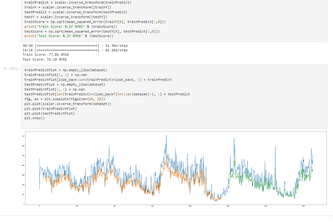
A prediction model to predict air pollution using India for (2015-19)
create your own link portfolio website with just a .json file
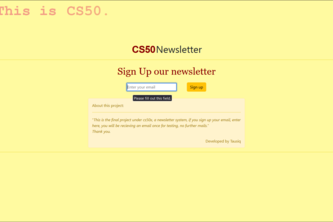
This was my project that I had done in my cs50x final project. And, it uses css framework bootstrap.
Analysis of the olympics dataset.
I followed a tutorial on neural style transfer using TensorFlow to generate a version of an image of a cat in the style of a painting by Piet Mondrian.
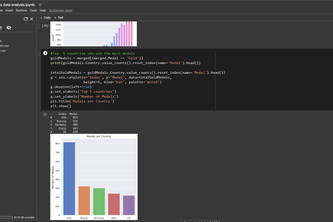
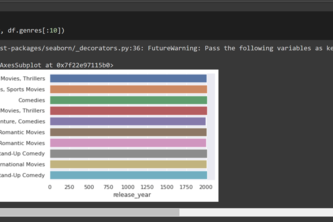
Represented a kaggle dataset (Latest Netflix TV shows and movies) pictorially using data visualization libraries like matplotlib, seaborn in the python programming language.
1 – 24 of 49